Last updated: July 30, 2026
The Company Views pages are the most frequently used pages in our solution. They contain different tables and graphs showing financial figures and ratios for any company, along with tools to change data, view how ratios are calculated, generate automatic reports, and more.
Section 1
Tabs
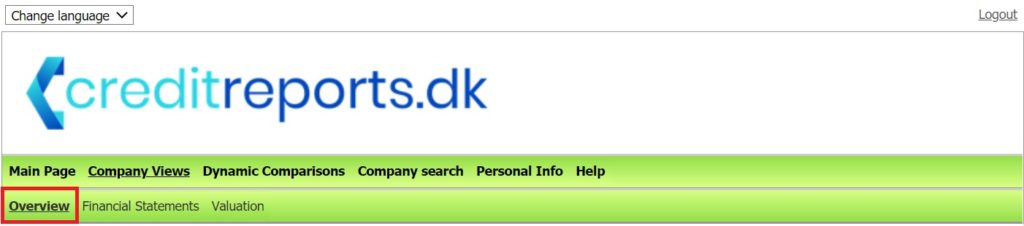
The Company Views have many different sub-pages for different purposes, accessible from the ribbon under the Company Views section.
Overview
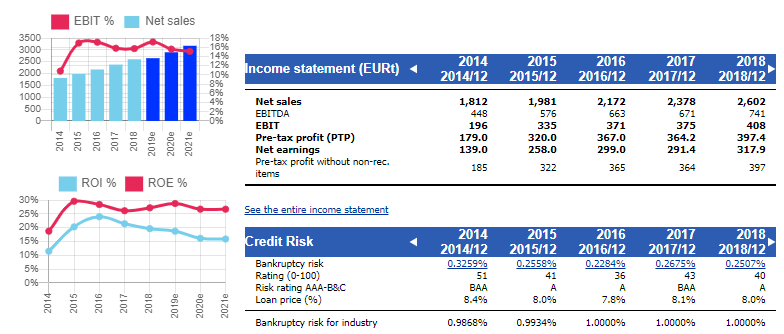
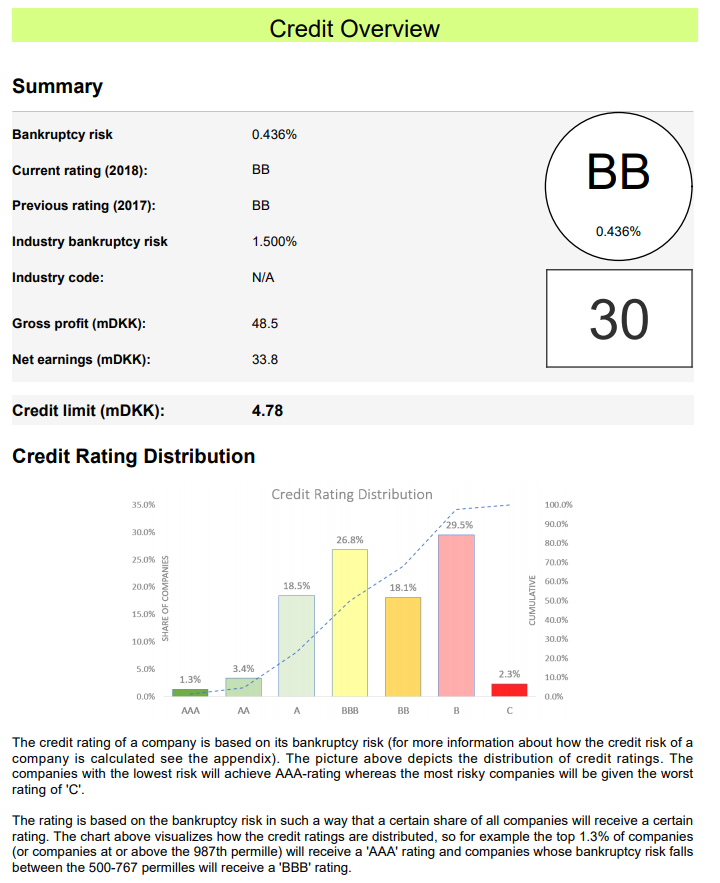
The Overview page is the most important section. It provides numbers and graphs about the most important company variables to give a strong first impression.
The page is organized into tables that summarize aspects of the company such as its income statement, balance sheet, profitability, and solvency.
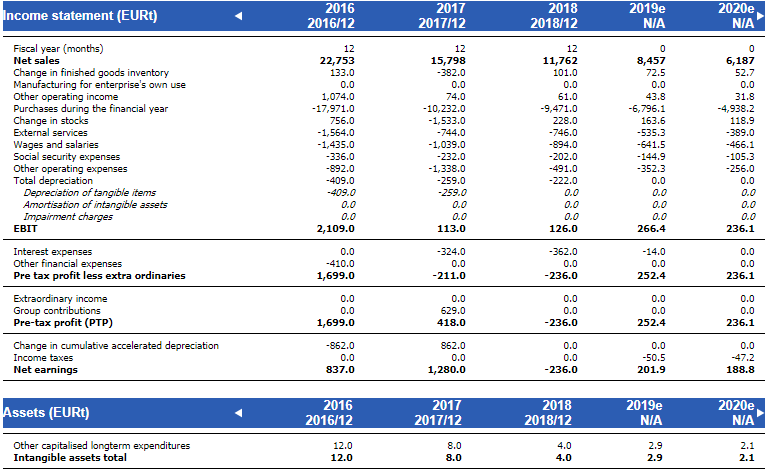
Financial statements
The Financial Statements page contains both historical and estimated data, split into three sections: income statement, assets, and equity & liabilities. All raw data is visible here — rows are hidden if they contain no data. Note that page layout can differ between companies.
Other pages
Company Views also include custom pages created to meet customer needs — Valuation, Graph collections, Cash Flow statement, and more. These are visible depending on customer configuration. Contact us if you need assistance with these pages.
Section 2
Generate estimates
Generate automatic estimates for a company by pressing the Generate Estimates button. A window appears where you can choose which years to overwrite with new automatic estimates — useful if you have already made manual estimates for some years and want automation only for later years. Once you click Confirm, estimates are generated and previous estimates for that scenario cannot be recovered.
For more information on how automatic estimates are generated, see the Estimate Generation page.

Section 3
Scenarios
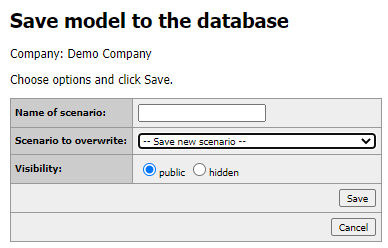
Create different scenarios for the same company — for example, bull and bear cases. Use the Change Estimates functionality to make different projections and save each with an appropriate name. Make sure to select Save new scenario from the drop-down menu; otherwise the currently selected scenario will be overwritten.
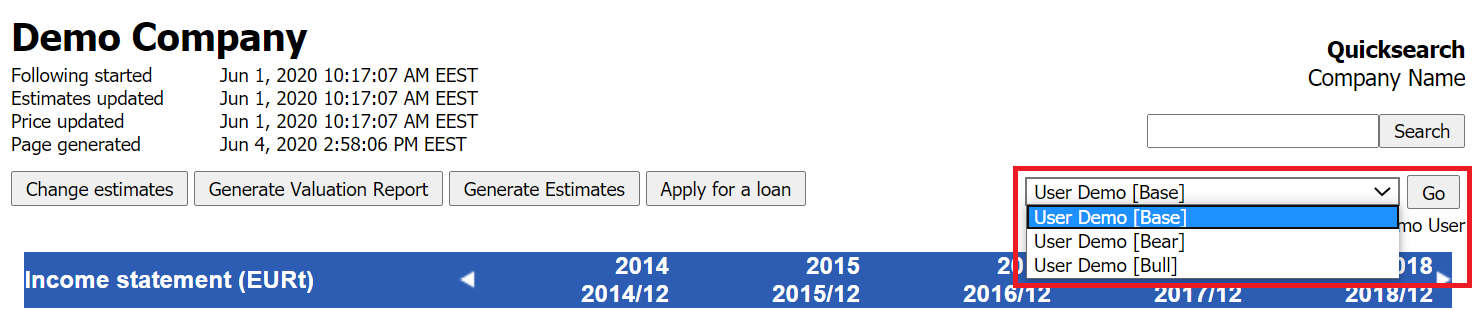
View all available scenarios from the drop-down menu under the search bar on any company page. Select the scenario and press Go to load it.
Section 4
Change estimates
Enter Change Estimates mode by pressing the button on any Company Views page. Variables that can be edited are shown in blue font — click any value, enter the new value, and press Enter or click the green check mark to confirm.

Some graphs can also be edited in Change Estimates mode — identified by Reset and Update buttons below. Drag values on the graph to your preferred level, then click Update. Note: clicking Update does not save — exit Change Estimates mode to discard unsaved changes.
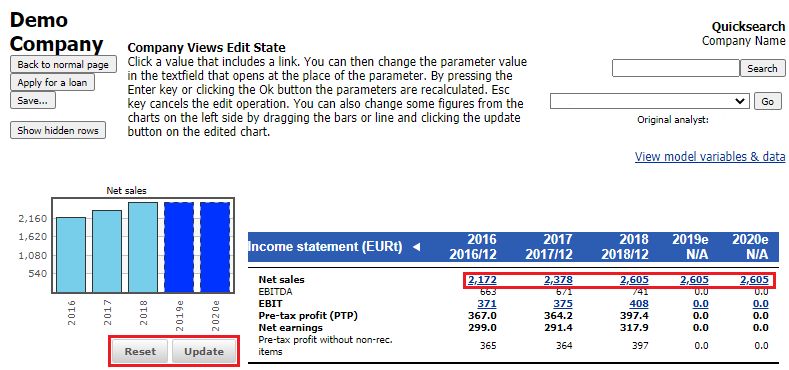
Variables are linked — changing net sales affects EBIT and net earnings; changing balance sheet items affects totals. Some recalculations take time, indicated by a red warning at the top of the page. Once that warning disappears, no further automatic changes occur until you make another edit.
Tip: Recommended input order
Insert estimates in the order they appear on the page. Input income statement values before balance sheet values, since income statement changes can affect balance sheet parameters.
Saving
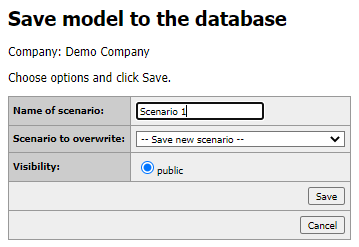
Once done editing, press the Save button. Choose a scenario name (optional), set visibility, and choose to save as a new scenario or overwrite an existing one. No changes are saved until this action is taken.
Section 5
Generate reports
Generate automatic reports by clicking Generate Reports on any Company Views page. Choose the report type, language, and format (PDF or Word document). PDF reports open in a new browser tab; Word documents are downloaded for further editing. You can also find a video tutorial about report generation on our Platform Tutorials page.

Section 6
Formula display
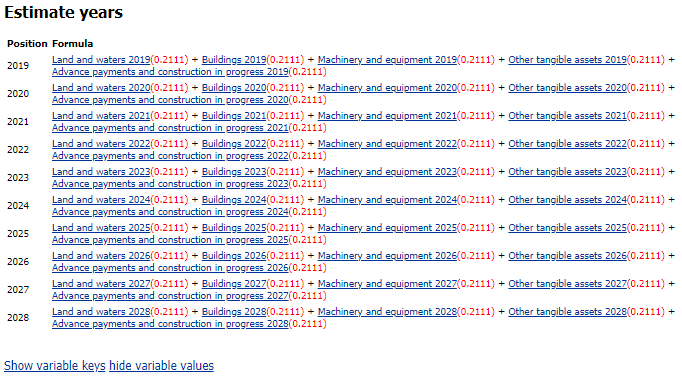
When viewing a Company Views page, click on any variable in the tables to open the Formula Display pop-up window. This is useful for checking or better understanding how a variable is calculated.
The formula display shows settings for the variable, followed by formulas for both historical and estimate years separately. Click on any variable name within the formula display to see how it is calculated — recursively exploring the formula chain.
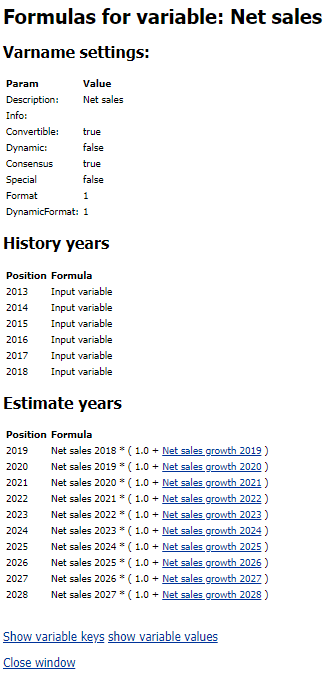
At the bottom of the formula display, two buttons are available: Show variable keys (internal variable names in the Valuatum system) and Show variable values (fetches and displays the actual values of each variable in the formula).