Last updated: July 30, 2026
The Valuatum system has tools to compare companies, the values of different financial variables, and industries. These tools are split into two groups: Dynamic XY Scatter and Dynamic Rankings.
Tool 1
Dynamic XY scatter
On this page, you can plot companies onto a scatter graph according to variables and value ranges of your choosing. Add variables using the Add new criteria button and set the minimum and maximum values for each variable. Click Apply filters to draw the scatter graph with a matching company list below. At least two criteria are required to generate a scatter graph — additional variables are shown in the list but not on the graph.
Save criteria for reuse by clicking Save current criteria. Access saved criteria from the drop-down list in the top-left corner. Filter companies by industry using the drop-down menu in the top-right corner.
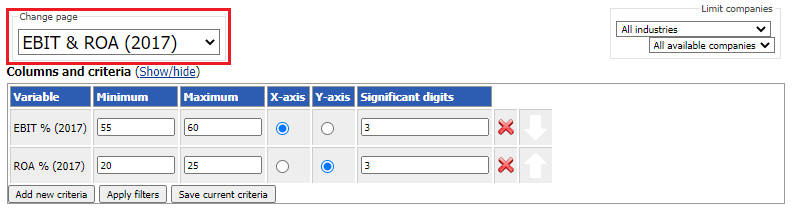
View variable values for any company by hovering over its dot on the graph. Click the dot or the company name in the list to navigate to that company's page.
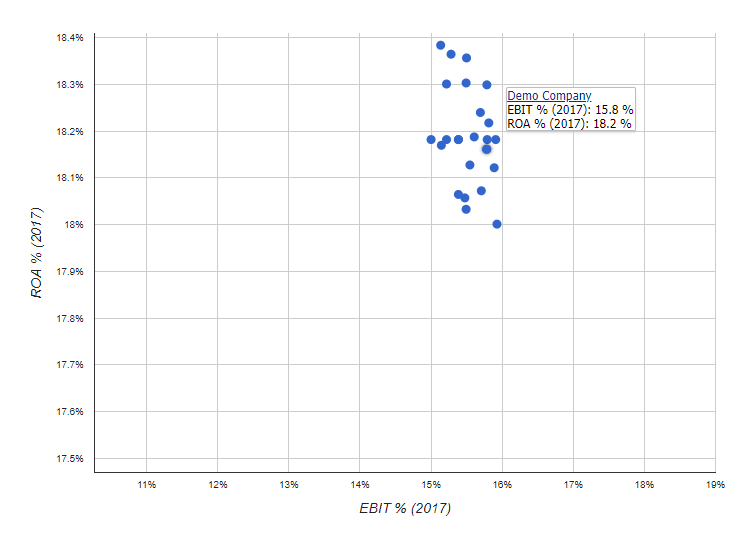
Navigate the graph by scrolling (zoom in/out) or dragging to pan. By default, companies are listed in descending order according to the first criteria. Click a variable name in the list header to re-sort.
Tool 2
Dynamic rankings
The Dynamic Rankings page works the same way as the Dynamic XY Scatter, but displays only the company list — without the scatter graph. This is useful for quickly ranking and filtering companies by financial metrics across an industry.
Add variables using Add new criteria, set your min/max ranges, and click Apply filters. Filter by industry from the top-right drop-down. Save criteria for reuse, and click variable headers to re-sort the list ascending or descending.