Credit Risk Model Overview
How our XGBoost machine-learning model works, why it outperforms traditional methods, and empirical performance results.
Last updated: July 30, 2026
In today's volatile financial environment, assessing corporate credit risk with precision is more crucial than ever. Our AI-driven credit risk platform sets a new market standard by delivering unmatched accuracy, explainability, and reliability. Built on the award-winning XGBoost machine-learning framework, our model enables businesses and financial institutions to make smarter, faster, and more profitable credit decisions.
Unlike traditional models that rely on fixed formulas and limited variables, our solution evaluates each company based on over 30 dynamic financial indicators, detecting subtle risk patterns invisible to standard tools. This enables clients to reduce credit losses by up to 60%, while confidently identifying high-risk companies before problems arise.
Visual proof of predictive power
Model performance at a glance
The charts below offer clear visual validation of our model's predictive strength. Companies are divided into ten equally-sized decile groups (10% each) ranked by assessed credit risk, from riskiest (bottom) to safest (top).
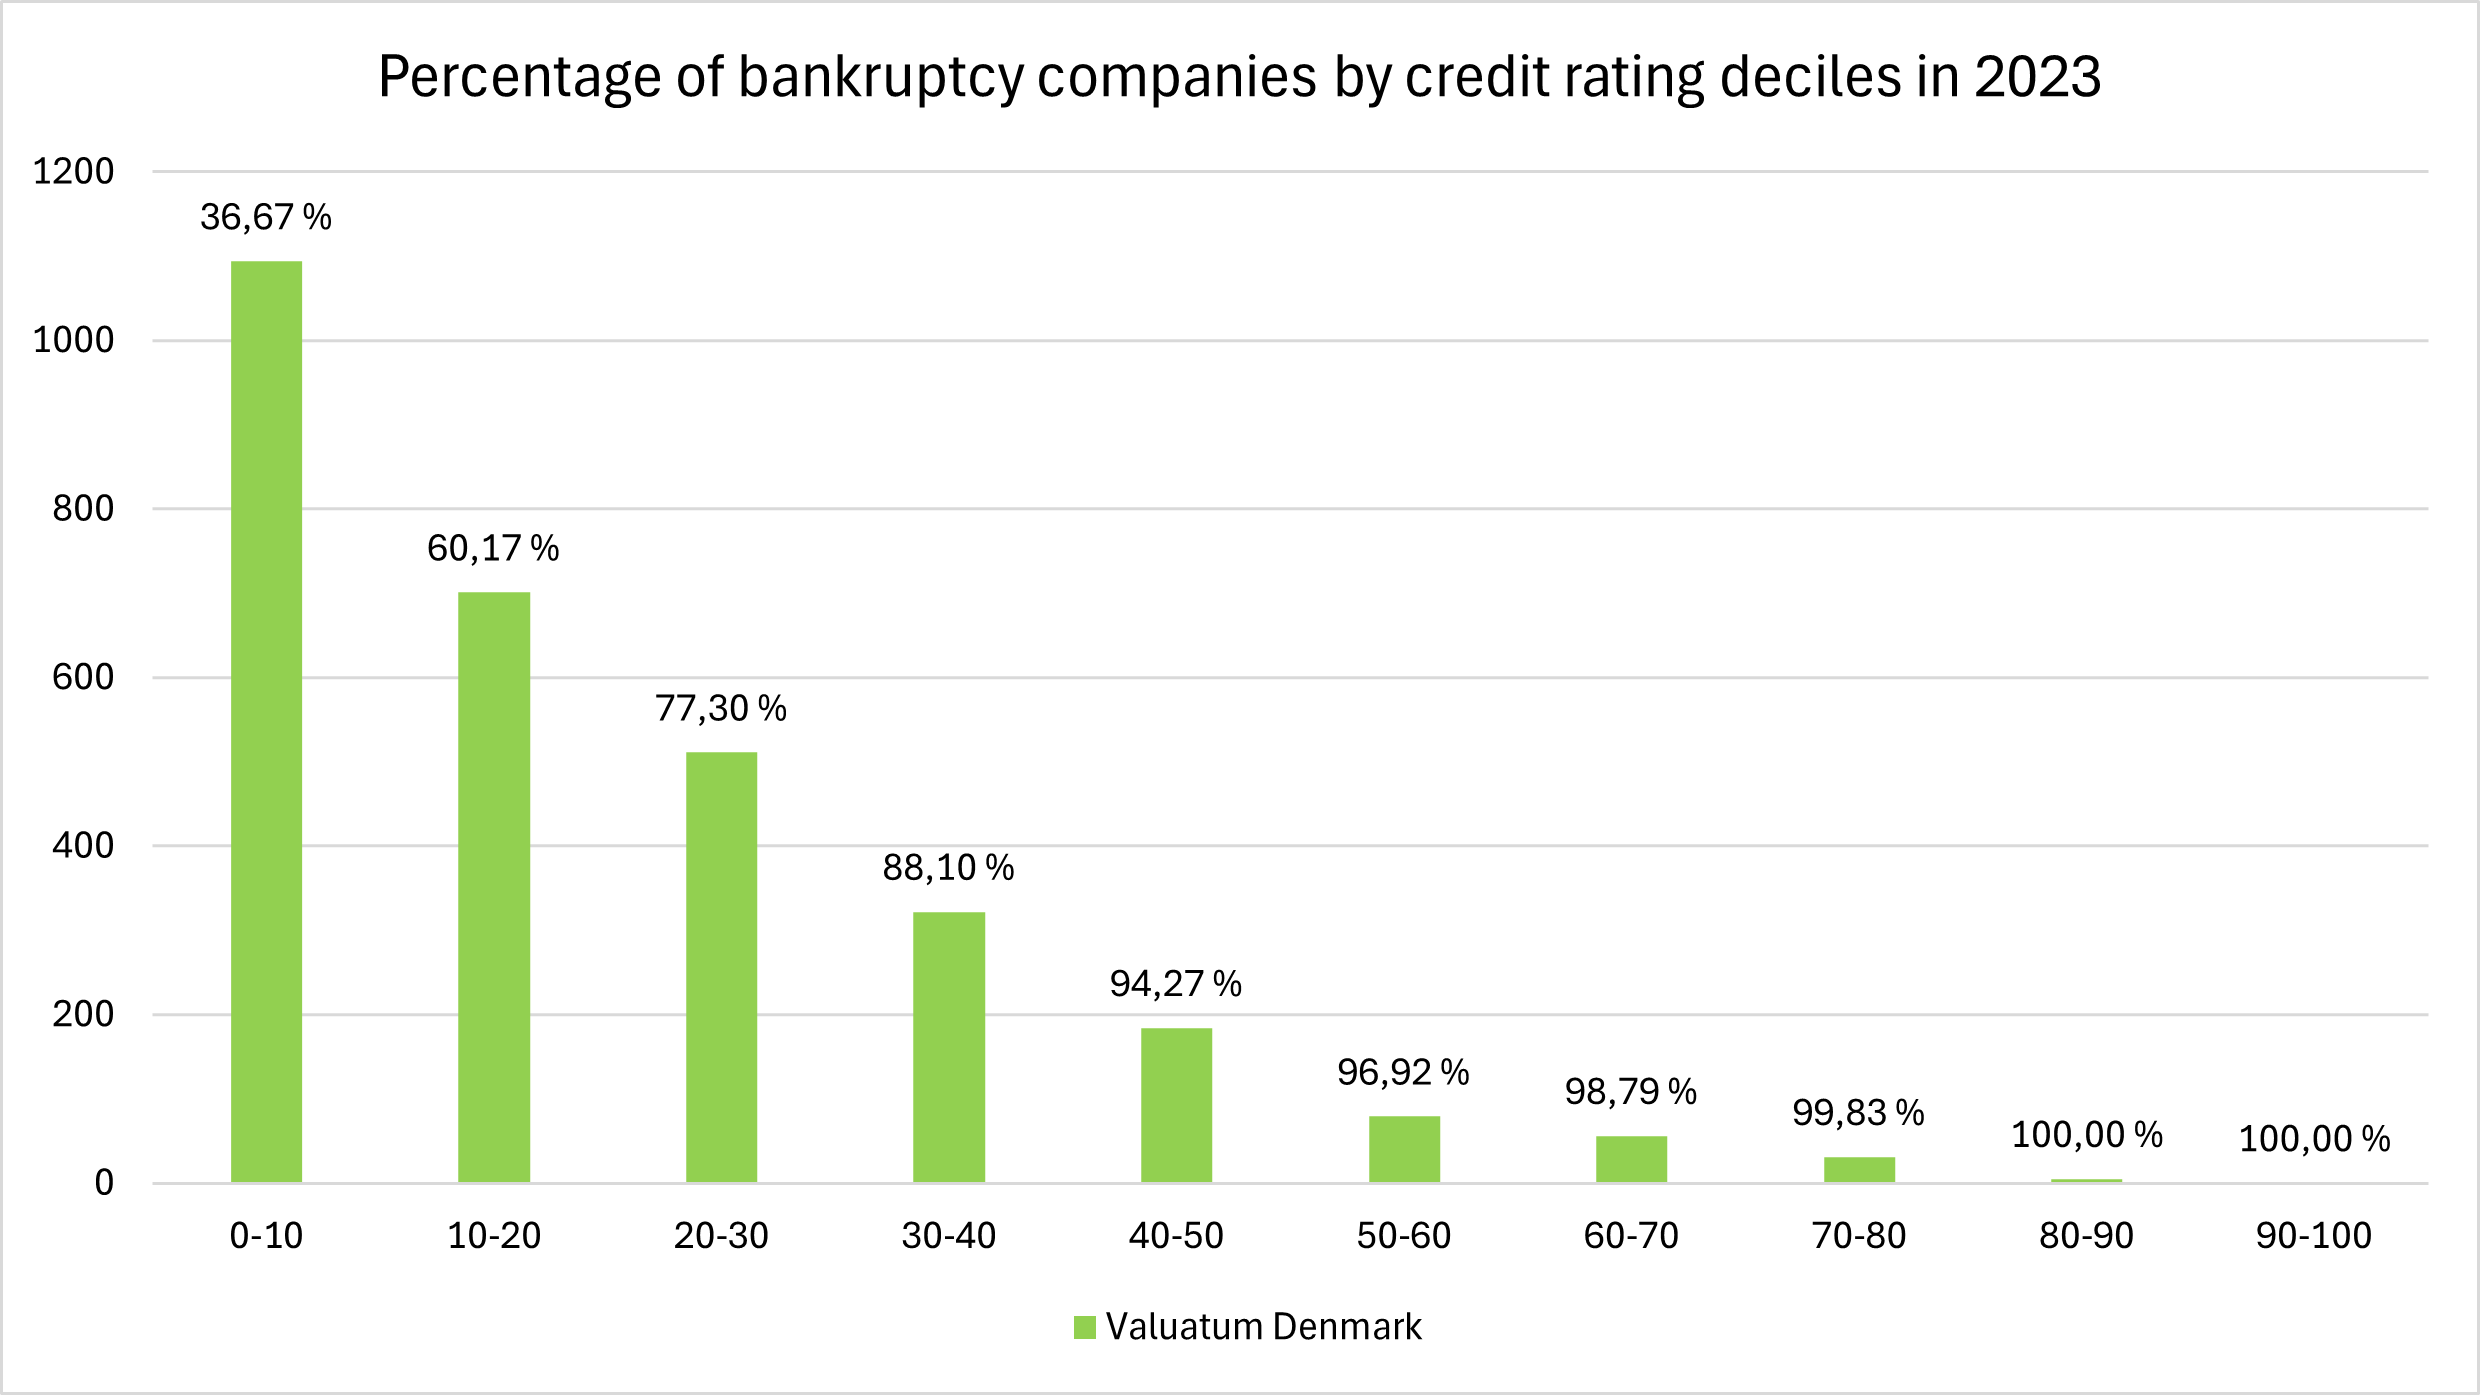
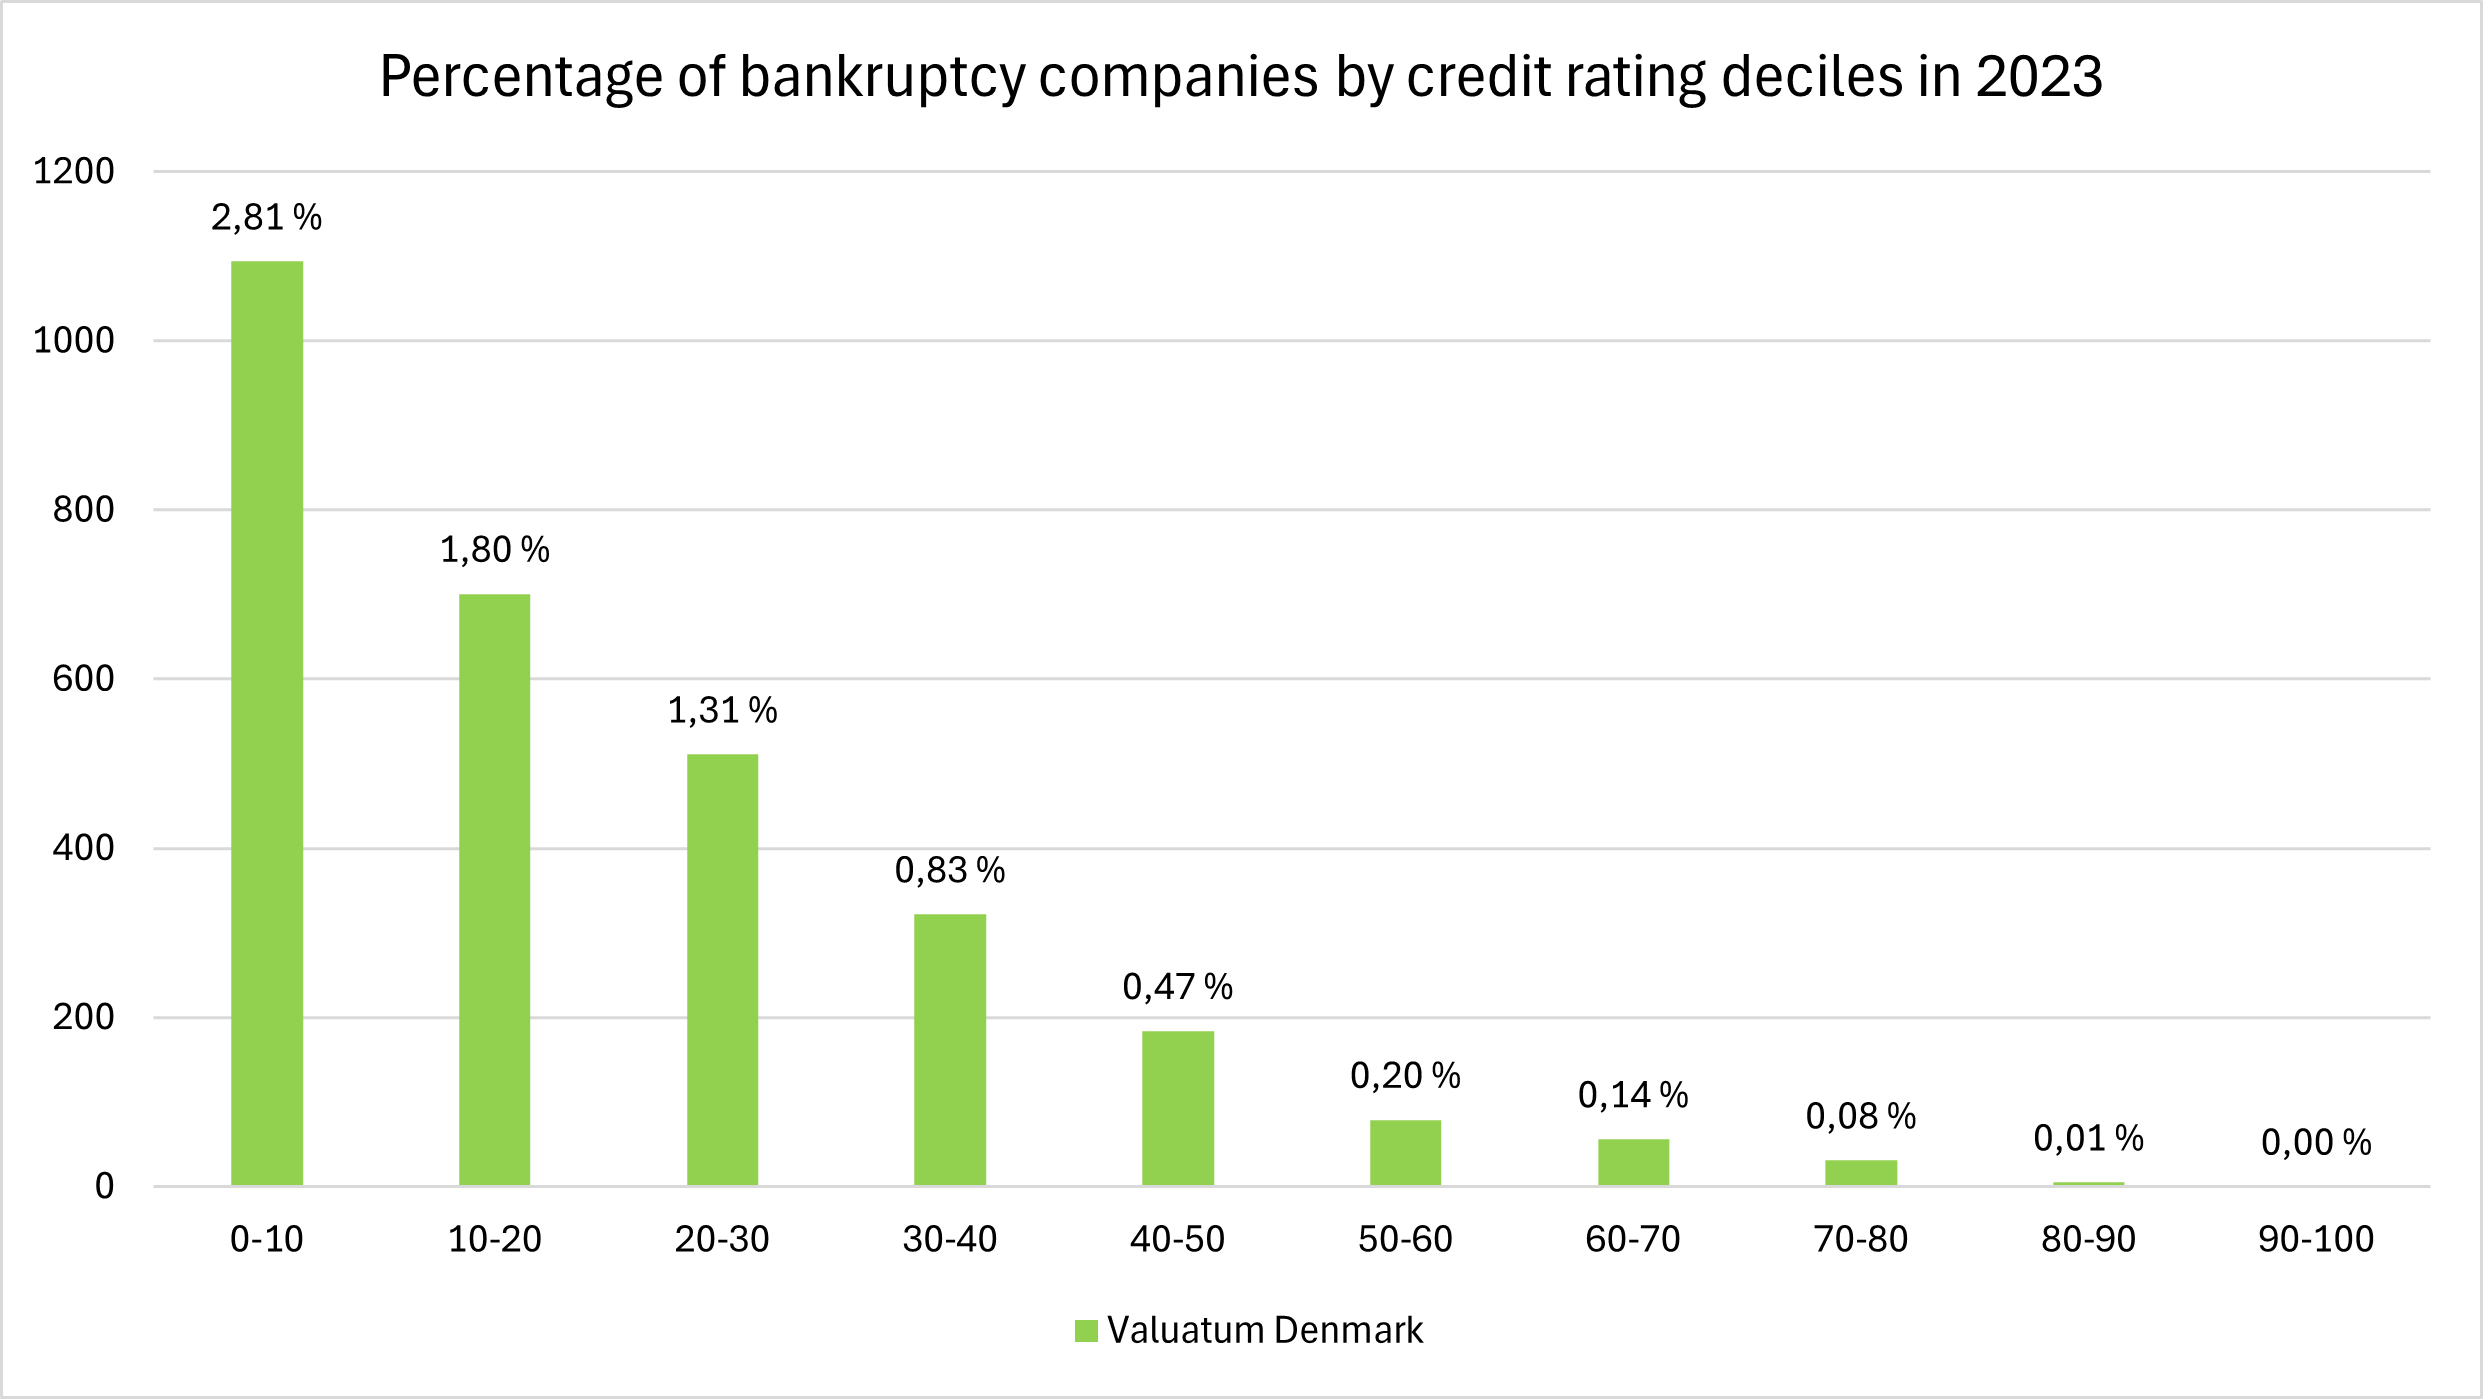
This dramatic drop-off from one decile to the next confirms the model's ability to sharply distinguish between risky and stable companies. Traditional models do not achieve similar predictive accuracy — as demonstrated in Section 3 below.
Section 1
The XGBoost model
The XGBoost model (eXtreme Gradient Boosting) is a machine-learning algorithm widely recognized for superior performance in predictive modeling, particularly in credit risk assessment. XGBoost is built on decision trees — data is split at various points starting from a single root and branching out based on specific conditions. For example, the first decision might be "Is net sales > 30 million DKK?" Each decision splits the data into smaller, more specific groups, eventually reaching leaf nodes with final predictions.
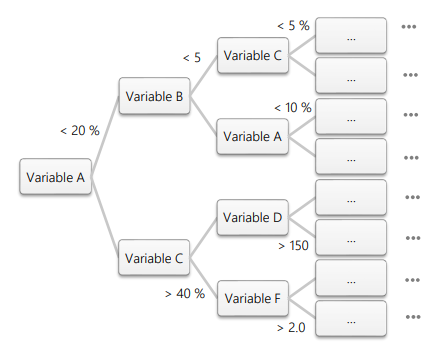
In XGBoost, instead of relying on a single decision tree, the algorithm builds an entire "forest" of trees where each new tree is designed to correct errors made by the previous ones. This ensemble approach allows XGBoost to make very accurate predictions by learning from its mistakes and refining decisions at each step.
Key financial variables used
Equity Ratio
Proportion of assets financed by shareholder equity
ROA %
Return on Assets — efficiency in generating profit
Quick Ratio
Ability to meet short-term obligations with liquid assets
+ Profitability indicators
+ Liquidity measures
+ Solvency & size variables
Our models have been developed in collaboration with Valuatum. Additional resources:
Section 2
Theoretical motivation behind XGBoost
Compared to older, traditional methods, XGBoost consistently outperforms due to several key differences in design.
Dynamic variable weights
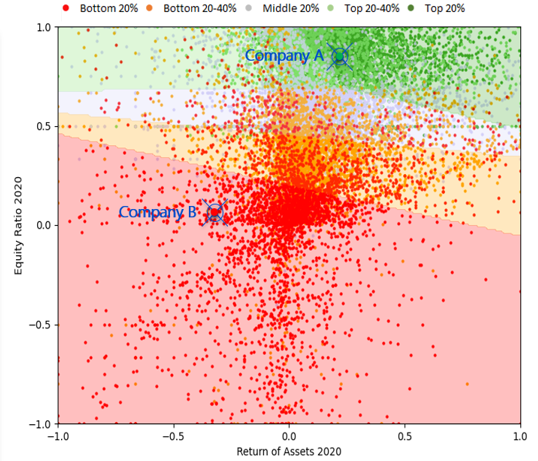
Traditional models apply fixed formulas uniformly. XGBoost adjusts variable importance based on individual company circumstances — for example, liquidity matters more for unprofitable firms versus profitable ones. Logistic regression has constant weights and cannot account for these firm-specific characteristics.
Number of model variables
XGBoost handles large variable sets without losing predictability. Traditional regression models risk overfitting with many variables, forcing selection of only key indicators and potentially omitting important signals — such as rising receivables per net sales, which can indicate future credit risk.
Explainability
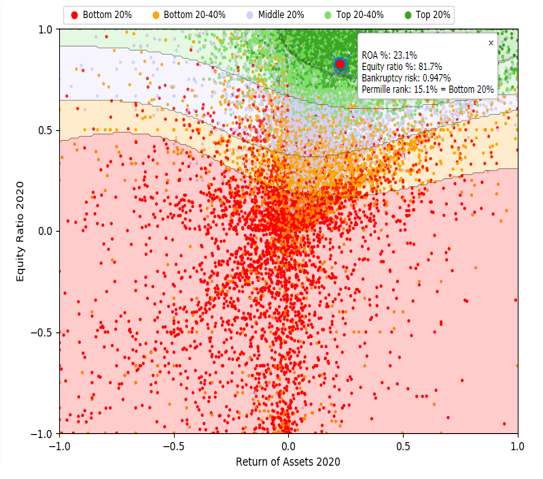
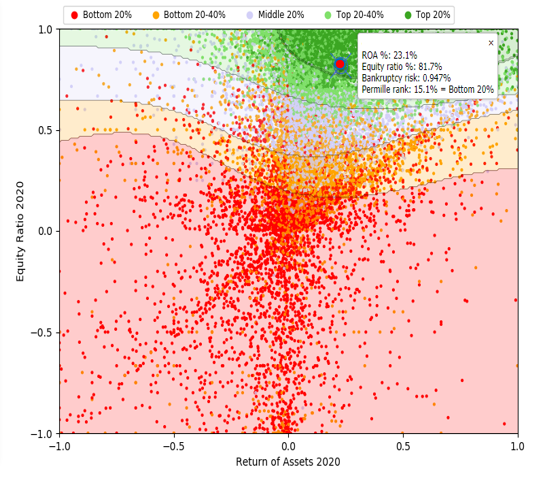
Unlike some ML approaches that are "black boxes," the platform provides clear visualizations and auto-generated plain-language summaries that explain why a company received its rating — including specific identified weaknesses.
Section 3
Empirical results of XGBoost model
The real proof of any model's effectiveness is how well it performs in practice. Here we present empirical results that showcase the accuracy and reliability of our XGBoost model — including academic studies and our own tests.
3.1. Academic results
Jabeur et al. (2023)
"Bankruptcy Prediction using the XGBoost Algorithm and Variable Importance Feature Engineering" — Computational Economics. Found XGBoost significantly outperformed logistic regression, with particular strength in handling imbalanced data. Read article →
Xia et al. (2017)
"A Boosted Decision Tree Approach Using Bayesian Hyper-Parameter Optimization for Credit Scoring" — Expert Systems with Applications. Demonstrated Bayesian optimization enhanced XGBoost performance in accuracy, AUC, and Brier score. Read article →
Robisco & Martinez (2022)
"Measuring the Model Risk-Adjusted Performance of Machine Learning Algorithms in Credit Default Prediction" — Financial Innovation. Confirmed XGBoost superiority over support vector machines and logistic regression, with SHAP-based interpretability. Read article →
3.2. Own test results — AI rating vs. logistic regression
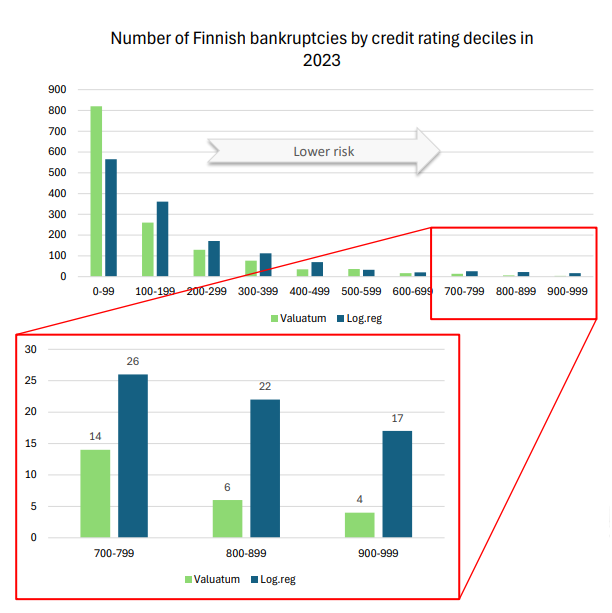
We calculated bankruptcy risk for ~200,000 Finnish companies using 2021 financial statements with both our AI model and a traditional logistic regression model. Companies were divided into ten equally-weighted risk groups and tracked against actual 2023 bankruptcies.
Logistic Regression
65
bankrupt companies in top 30% (most creditworthy)
~€25M projected losses on €10B issued
Our AI Model
24
bankrupt companies in top 30% (most creditworthy)
~€9.2M projected losses — 63.1% reduction
Expanding to Danish data
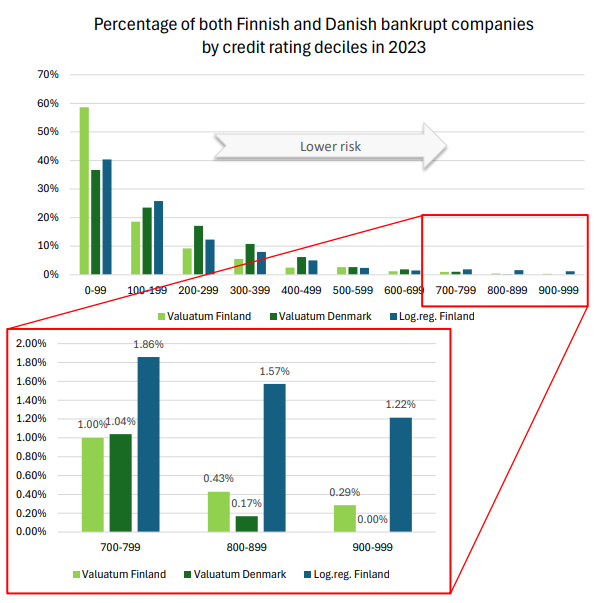
The following analysis extends the comparison to Danish bankrupt companies assessed using our AI model. The y-axis shows percentages to account for dataset size differences.
Performance evaluation
We compared our model against several benchmark models: XGBoost, random forest, artificial neural networks, an ensemble method, and logistic regression — using ROC-AUC as the evaluation metric. Approximately 170,000 Finnish companies and 30 input variables were used, with data split evenly for training and testing.

Reference
For additional context, we compare with results reported by Altman et al. (2014). ROC-AUC scores closer to 1 indicate stronger predictive ability; a score of 0.5 equals random guessing.
Section 4
Calculation methods of our parameters
Understanding how we calculate credit ratings, bankruptcy risk, and credit limits is crucial to appreciating the value of our model.
Credit rating & score
Credit rating classifies companies into larger groups based on their assessed bankruptcy risk. We use a standard seven-tier scale from AAA to C, where AAA represents the lowest bankruptcy risk and C the highest. For example, companies at or above the 98.7th percentile (top 1.3%) receive a 'AAA' rating, while those between the 33.4th and 66.6th percentiles are rated 'BBB'.
Credit score (0–100) is the company's risk percentile relative to all other companies. A score of 78 means the company has lower risk than 78% of all companies in that year — supplementing the broader rating class.
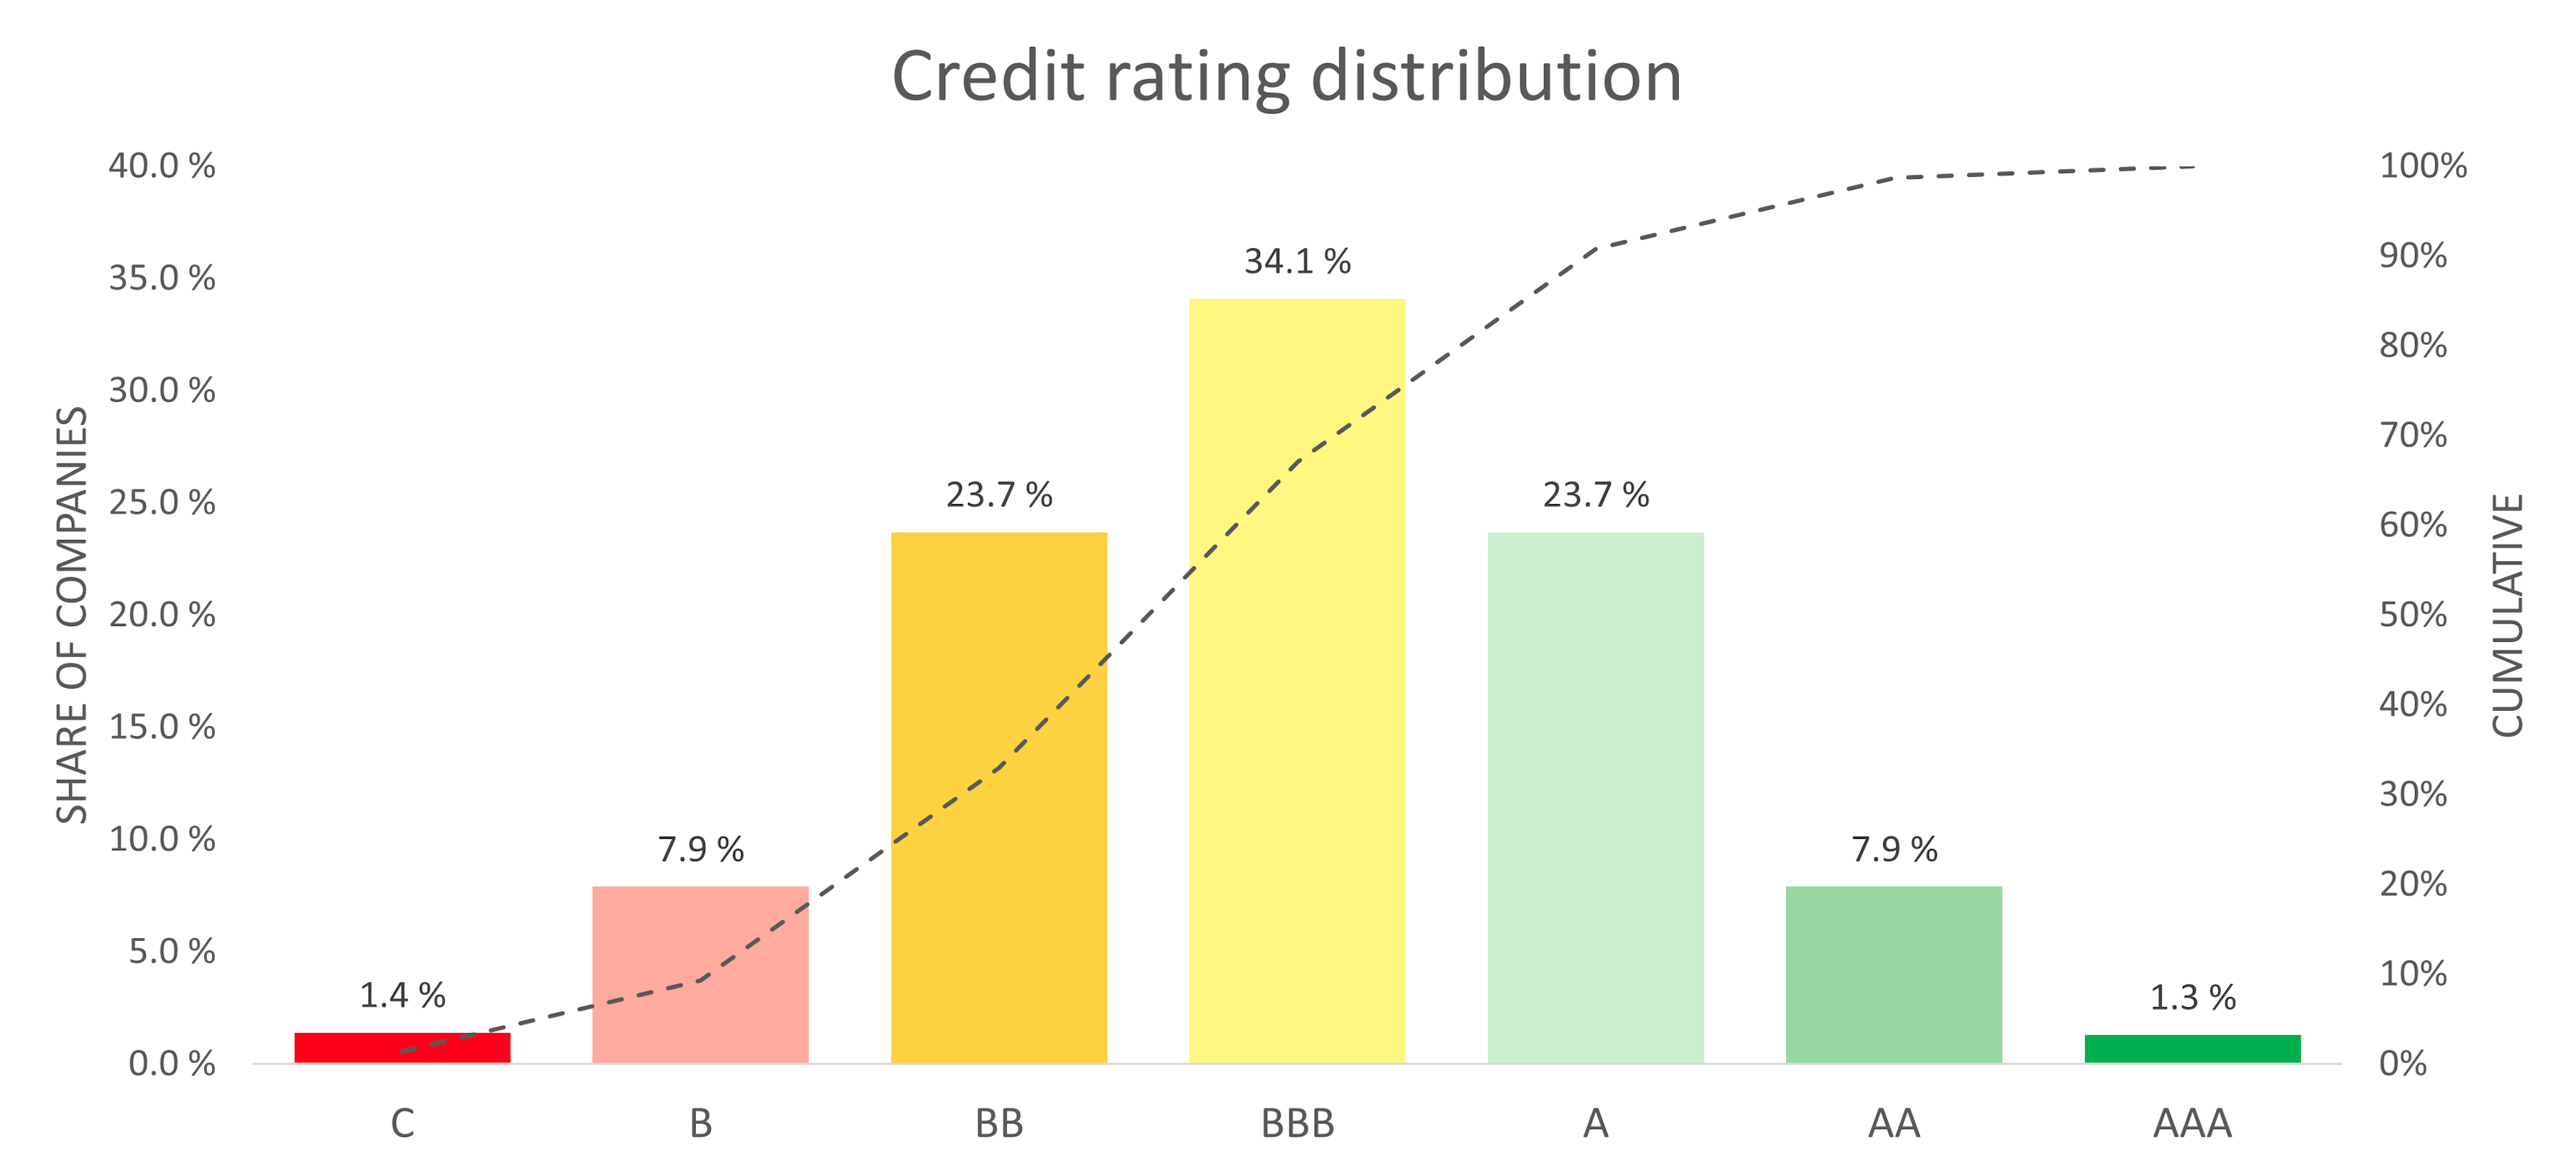
| Rating | Percentile range | Risk level |
|---|---|---|
| AAA | ≥ 98.7th (top 1.3%) | Lowest risk |
| AA | 93.4–98.6th | Very low risk |
| A | 80.0–93.3rd | Low risk |
| BBB | 66.7–79.9th | Moderate |
| BB | 53.4–66.6th | Elevated |
| B | 33.4–53.3rd | High risk |
| C | Below 33.4th | Highest risk |
Bankruptcy risk
Our bankruptcy risk probability assesses the likelihood of a company failing to meet its financial obligations and declaring bankruptcy within the next 24 months. The model uses XGBoost with approximately 30 explanatory variables. In our evaluations, XGBoost has consistently outperformed alternative approaches including random forest and logistic regression.
Credit limit
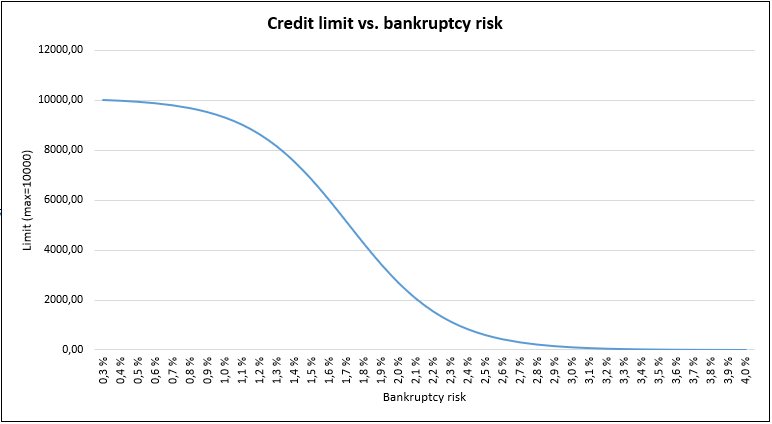
We provide a preliminary estimate for a potential credit limit, determined by a company-specific maximum and its bankruptcy risk. The maximum limit calculation accounts for factors including shareholders' equity and available cash. This maximum is then adjusted based on bankruptcy risk as illustrated below.
Important note
The credit limit we provide is an estimate based on a limited set of variables and bankruptcy risk assessment. We strongly recommend conducting a comprehensive evaluation of the company's financial status before making any decisions regarding the loan amount.
Summary & Strategic Advantage
Reliable, transparent, and intelligently optimized, our AI-powered credit risk model represents the next generation in corporate risk assessment. Whether you're aiming to reduce credit losses, make faster loan decisions, or conduct more accurate B2B analyses, our solution delivers measurable value and a true competitive edge. It's time to move beyond outdated models and toward data-driven credit intelligence.