Credit Risk FAQ
Answers to common questions about credit ratings, how they are calculated, and how to interpret the results.
Last updated: July 30, 2026
Credit ratings often raise questions, especially when a company's own experience of its business situation does not seem to match the assigned risk category. Valuatum's credit rating is based on statistical analysis that takes into account the company's financial ratios, balance sheet, liquidity, industry risk level, and other factors. Below you will find the most common questions and answers.
Rating basics
Estimating and understanding credit ratings
The chart below illustrates how Danish companies are positioned in Valuatum's rating model based on key financial indicators. Each point represents one company:
- The horizontal axis shows profitability (return on assets)
- The vertical axis shows solvency (equity ratio)
Companies in the upper-right corner are typically profitable and financially solid, while those in the lower-left have weaker profitability and solvency. Green dots represent lower risk companies; red dots represent higher risk.
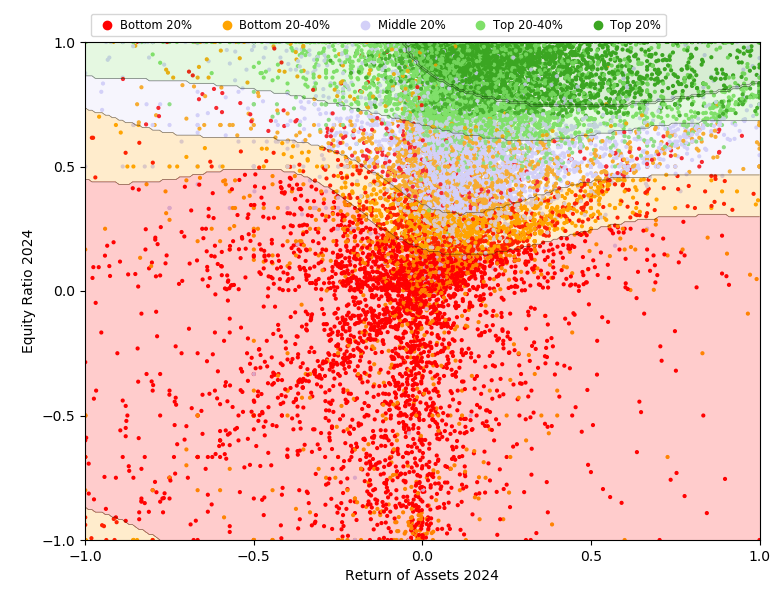
For typical situations, achieving an "A"-level rating — placing a company among the top 20% of Danish companies — usually requires an equity ratio of 75–100% and positive return on equity.
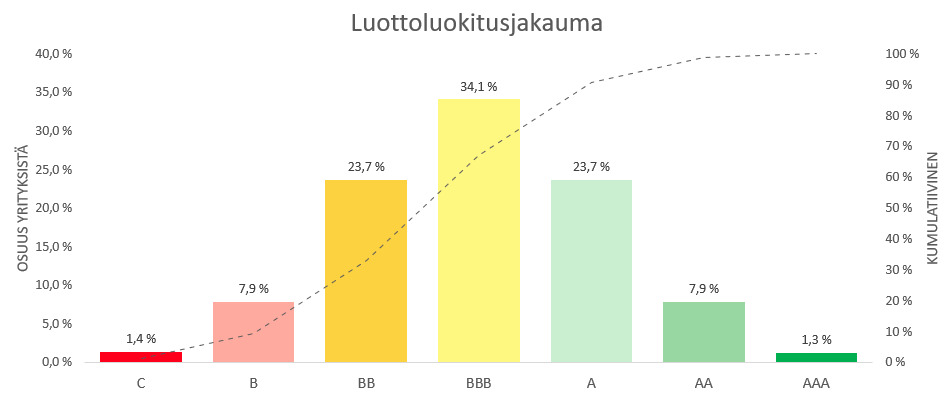
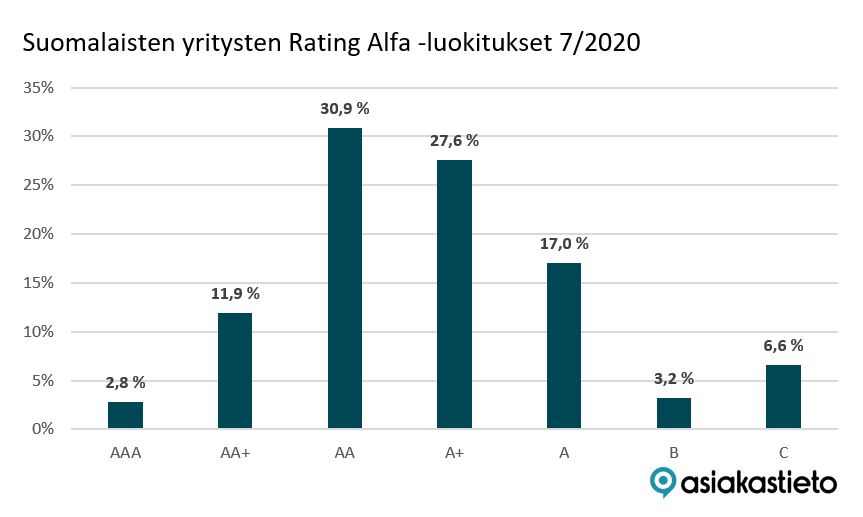
In Valuatum's model, ratings are calibrated so that only about one-third of companies fall into "A" categories — consistent with the distributions used by international credit rating agencies such as Standard & Poor's. By contrast, some competing services classify around 90% of companies into "A" categories.
The difference does not reflect a different assessment of actual risk, but rather how ratings are distributed across the overall population of companies.
Valuatum's credit rating distribution
Asiakastieto's rating distribution (owner of Proff.dk)
Calculation
How credit ratings are determined
- Solvency, especially the equity ratio
- Profitability, such as return on capital
- Liquidity — the size of cash reserves relative to business volume and short-term liabilities
- Balance sheet structure — how assets are distributed between cash, receivables, and other items
- Industry risk — how frequently companies in that industry fail on average
Weak ratings
Understanding weak credit ratings
- Equity is small relative to the scale of the business
- Cash buffers are thin
- The industry carries higher-than-average risk
- The balance sheet does not provide sufficient protection against potential disruptions
Changes & improvement
Rating dynamics and how to improve
- Strengthening equity
- Increasing cash buffers
- Improving profitability
- Strengthening the balance sheet relative to the scale of the business
- Improving risk management and the predictability of business operations